How I use pivot tables for exploration and pivot charts for communication—when to choose each and how they work together.
How I use pivot tables for exploration and pivot charts for communication—when to choose each and how they work together.
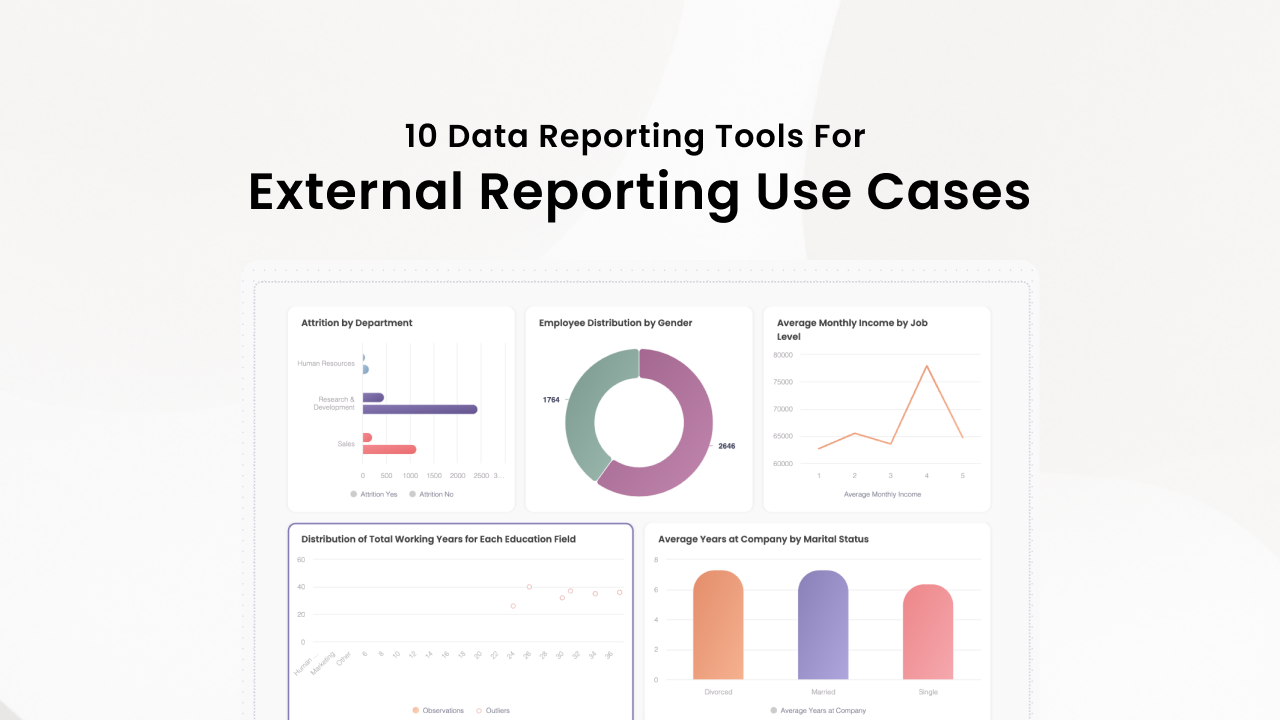
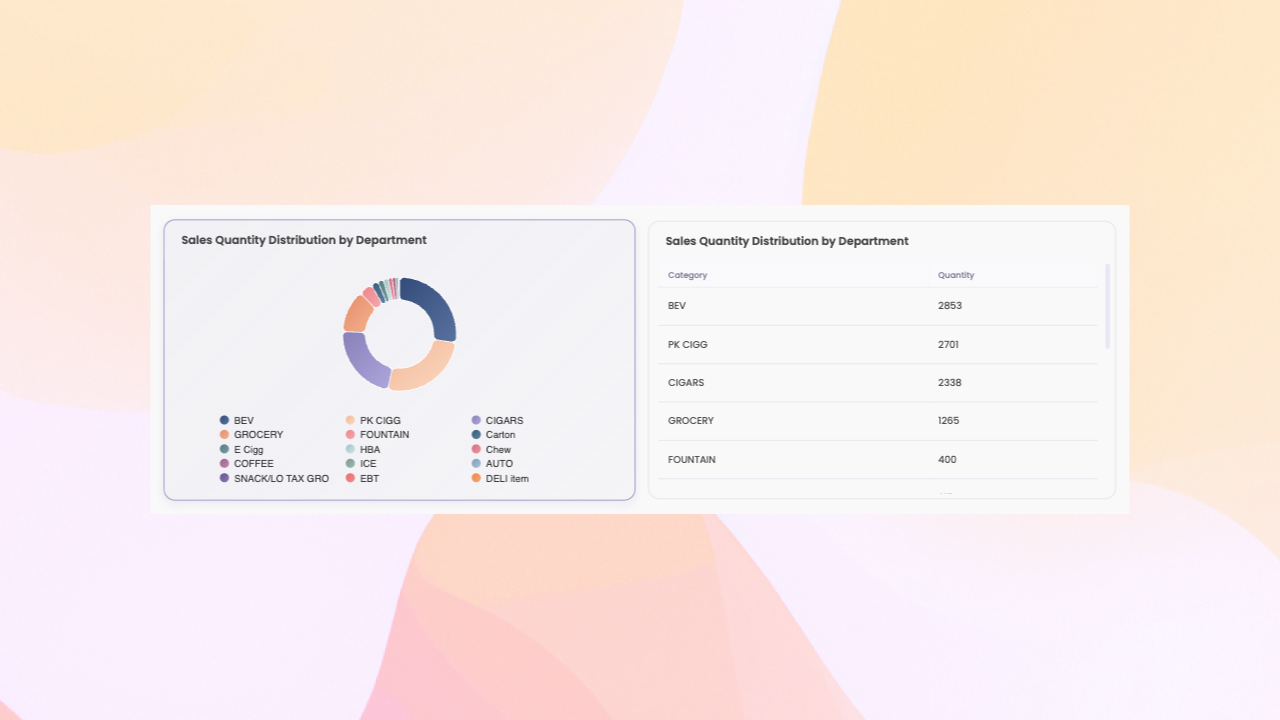
Discover the best data reporting tools for sharing analytics with clients, stakeholders, and partners. Compare traditional BI platforms with modern AI-powered solutions for external reporting needs.

Looking for a Tableau alternative that is faster, easier, and built for non-technical teams? Discover why AI-powered tools like Breadcrumb are replacing static dashboards with dynamic, shareable insights.
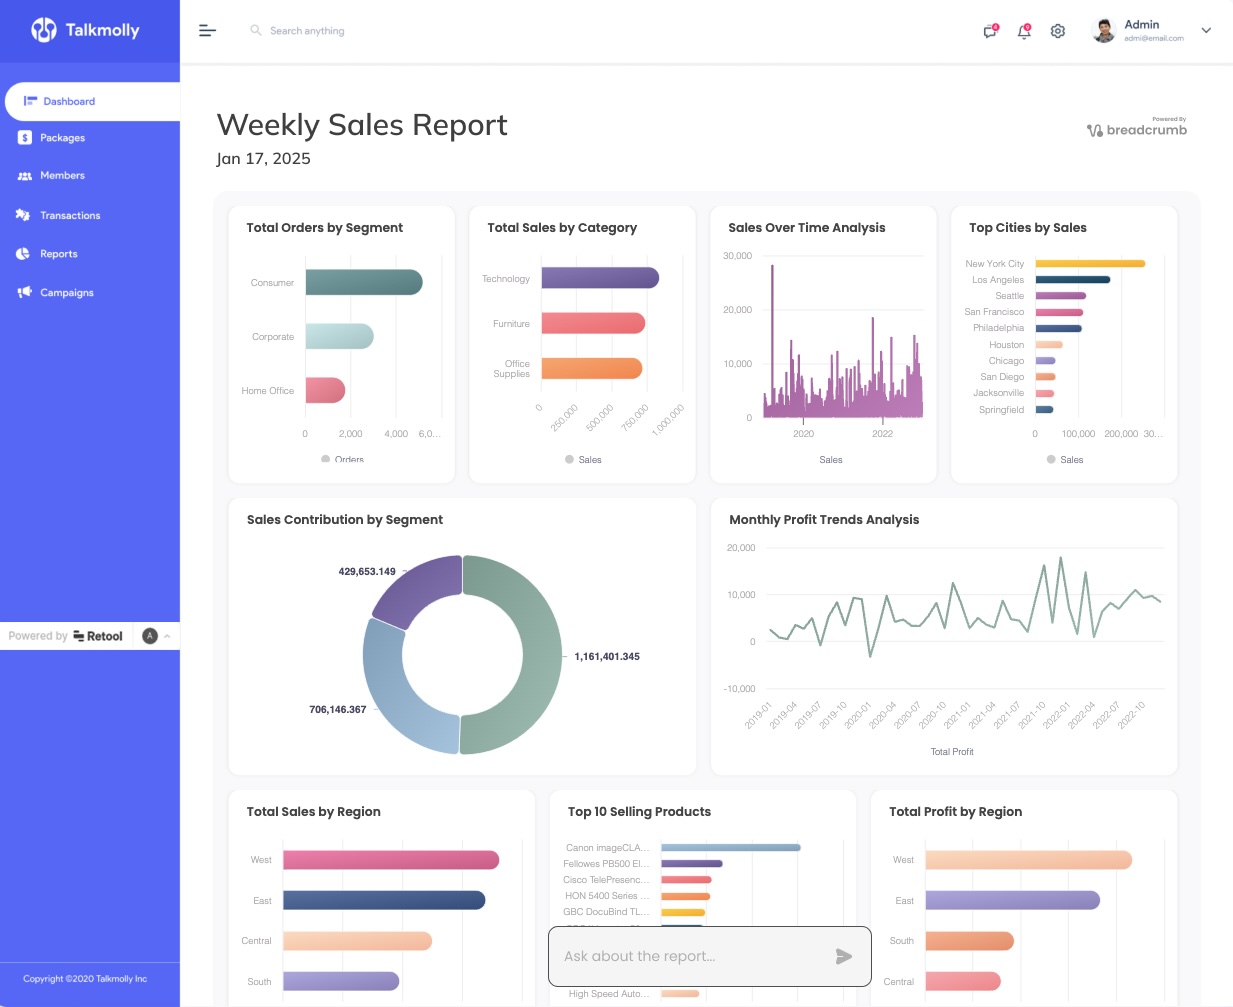
Learn how to create powerful analytics dashboards in Retool without writing any code or SQL. Build and embed dynamic data visualizations in minutes using generative AI.